Surface melt on the Antarctic and Greenland Ice Sheets (1979 - 2025) using SMMR and SSM/I
This dataset provides daily surface melt in Antarctica and in Greenland. Surface melting is retrieved from passive microwave radiometer data (SMMR and SSM/I) using the algorithm developed by Torinesi et al. 2003 and Picard and Fily 2006. The microwave data are from two NSIDC datasets: SMMR and SSM/I. The surface melting dataset is provided with a spatial resolution of 25 km but the SSM/I sensor has an effective resolution of about 60 km at the frequency used here. The temporal resolution is 1 day (2 days before 1988) and records are almost continuous since 1979, except a long data gap in the summer 1987/1988. In September 2025, NSIDC stopped producing the brightness temperature dataset, and I'm unable to continue updating
Download
Alternative Dataset: The melt dataset retrieved from AMSR-E and AMSR2 on a shorter period (2002-present) but with a higher resolution (10 km) is available for Greenland and for Antarctica. It is worth noting that SSM/I overpass is 6am and 6pm local time, while AMSR-E and AMSR2 overpass is 1:30am and 1:30pm local time. The difference in acquisition hours may have some implications for the melt detection and the trend analysis as investigated by Picard and Fily (2006). For instance, the SSM/I dataset may miss some melt events occurring during the day.
Daily Surface Melting Dataset
This dataset includes for every pixel and day the status wet/dry snow. The data is provided on the stereographic polar grid for every day since 1st April 1979 for both hemispheres. The grid has a 25 x 25 km² resolution (see NSIDC information) In Antarctica, the grid is a cropped version of the Southern stereographic polar grid used by NSIDC. The cropped size is 231 x 201, with an upper left pixel at the coordinates (40,70) and a lower right pixel at the coordinates (271,271). In Greenland, the grid is a small area of the Northen stereographic polar grid used by NSIDC. The size is 60 x 109. The upper left pixel has coordinates (129,260) in the NSIDC Polar grid and the lower right pixel has coordinates (189 369). For ease of use, the latitude and longitude of each pixel center are included in the dataset.
The pixels are classified as follow:
- 0 : dry snow
- 1 : wet snow
- -10 : no available data or masked out .
The mask excludes the ocean. In Antarctica the areas above 1700 m.a.s.l. are also excluded. The mask does not change over time which has some implications where the coast line has changed during the time-series. For instance, Larsen A and B Ice Shelves in Antarctica are included although they desintegrated from 1995 and 2002 respectively. Melting information after desintegration is irrelevant in this area, and any trend analysis should take into account this change of the coastlines.
The files are in the NetCDF format.
Download
The most up-to-date dataset:
- Antarctica: Surface Melting 1979-2025 Dataset version 1 [ DOWNLOAD (6 Mb) ]
- Greenland: Surface Melting 1979-2021 Dataset version 0 (preliminary) [ DOWNLOAD (4 Mb) ]
The archives include two files: one with missing satellite data filled by interpolation but with 1-day events removed. The other file (called raw) has no interpolation and no filtering. Other sort of processing can be provided upon request. Also, melt data with a twice higher resolution from AMSR-E and AMSR2 can be provided.
Cumulative Melting Surface in Antarctica
The Cumulative Melting Surface (CMS) is defined as the number of melted pixels for an entire summer and an entire region multiplied by the surface of a pixel (25 x 25 km²). Its unit is expressed in day km². The Antarctic regions used here were defined by Zwally et Fiegles, 1994. See figure:
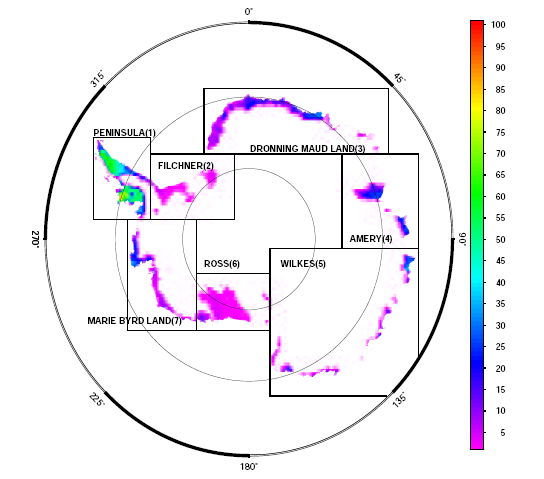
The CMS for the different regions have been corrected from changes in acquisition hours due to satellite replacements with the method developed by Picard and Fily, 2006. Both corrected and uncorrected CMS are available for download. To our opinion, the correction efficiently reduces errors for some regions (Peninsula, DML, Amery, Wilkes, MBL), but is less efficient or may add new errors for other regions (Filchner, Ross). In the latter regions, we recommend to use both the corrected and uncorrected CMS.
The file is organized in two columns. The first is the year corresponding to the end of the summer (e.g. 1980 corresponds to summer 1979/1980) and the second the CMS expressed in 106 km2 day.
- Corrected CMS ver 1.0 (1979/1980-2005/2006): [ DOWNLOAD]
- Uncorrected CMS ver 1.0 (1979/1980-2005/2006): [ DOWNLOAD]
Condition of use
The dataset and other information on this page are provided "AS IS", without warranty of any kind. Ackownledgment in publications will be appreciated and (one of) the following citations is suggested:
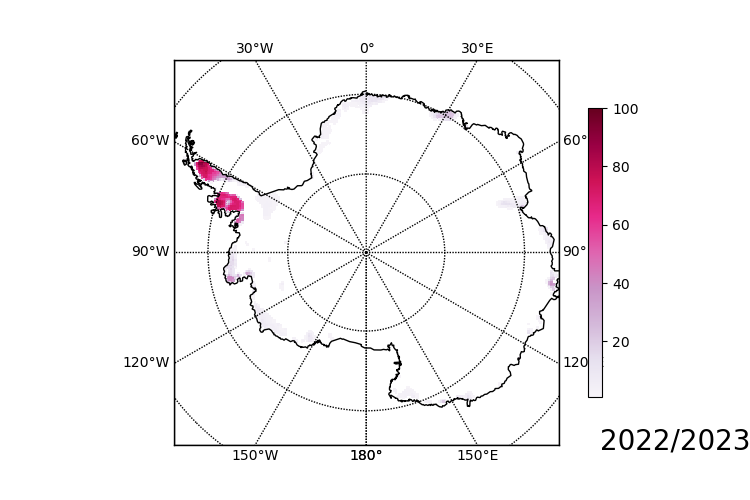
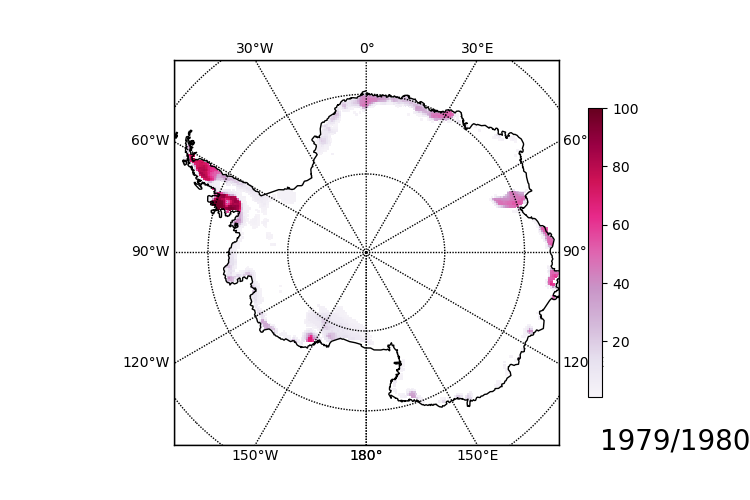
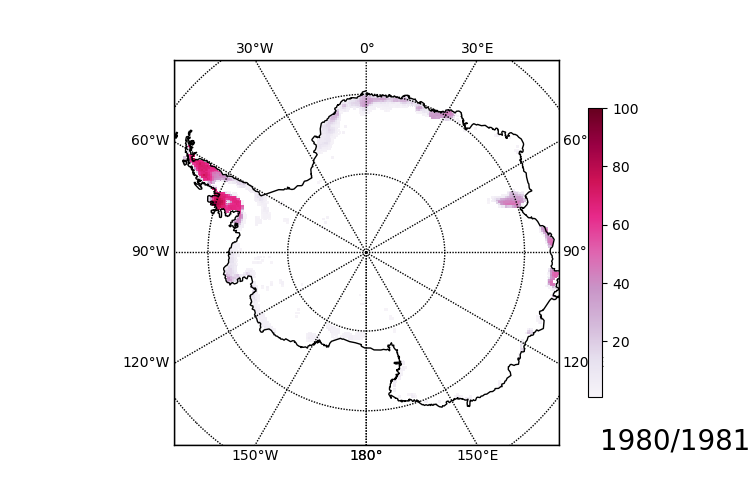
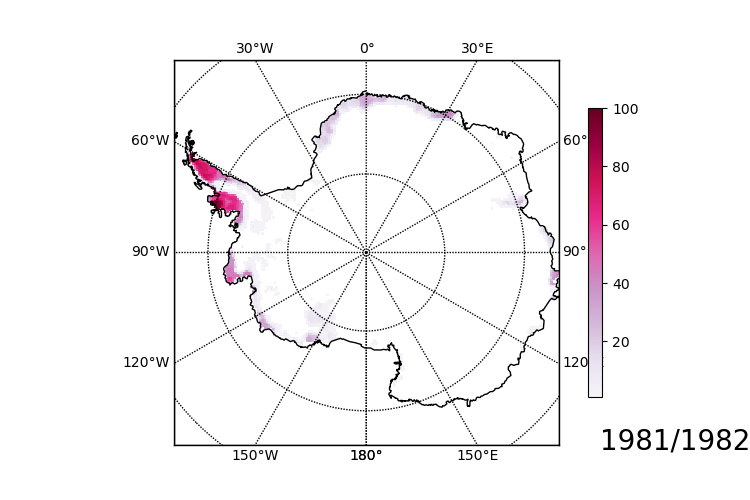
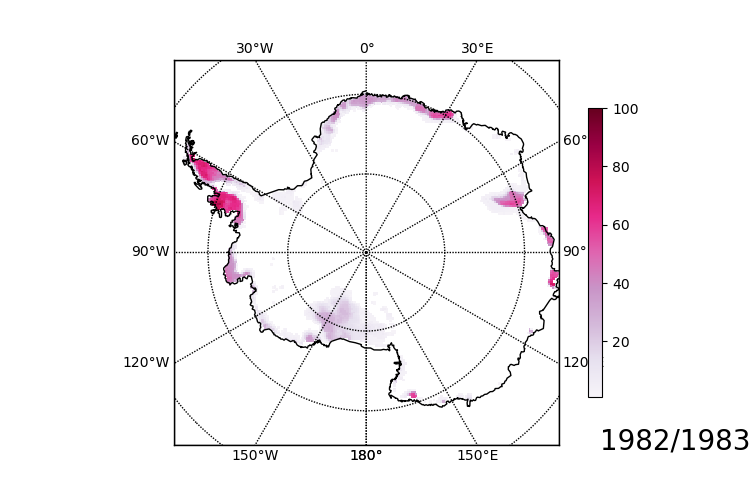
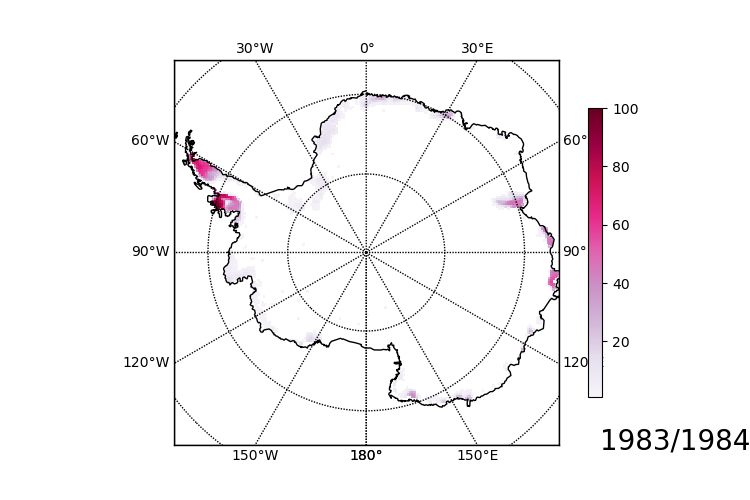
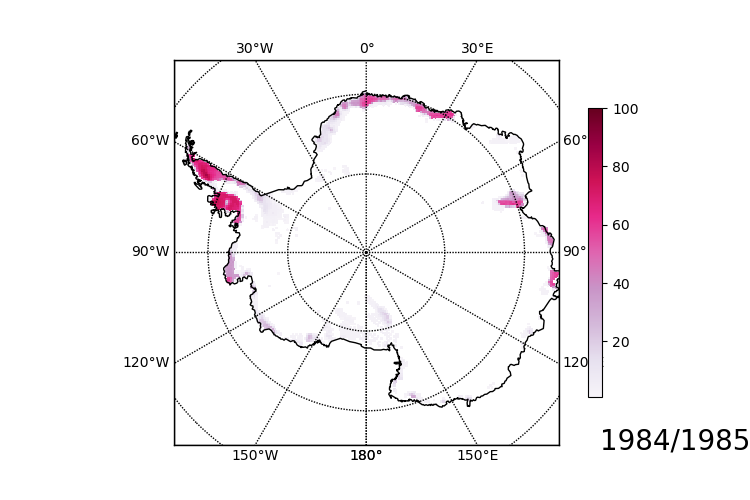
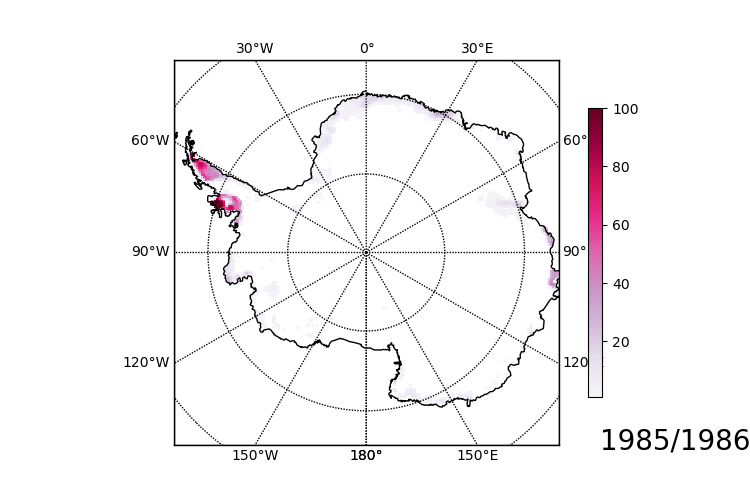
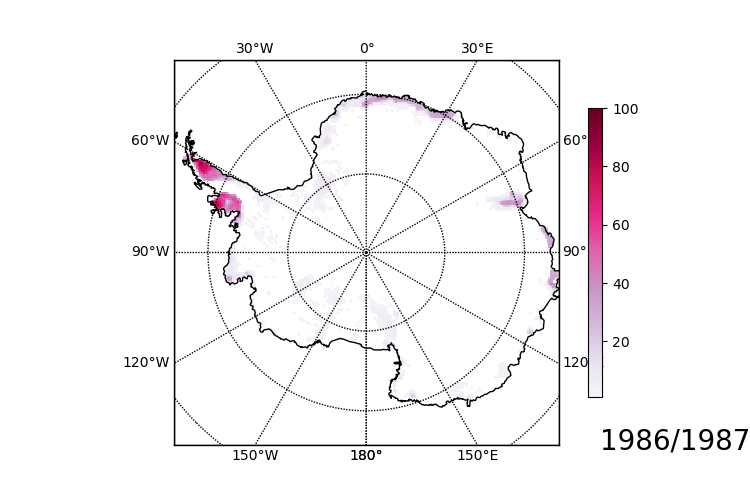
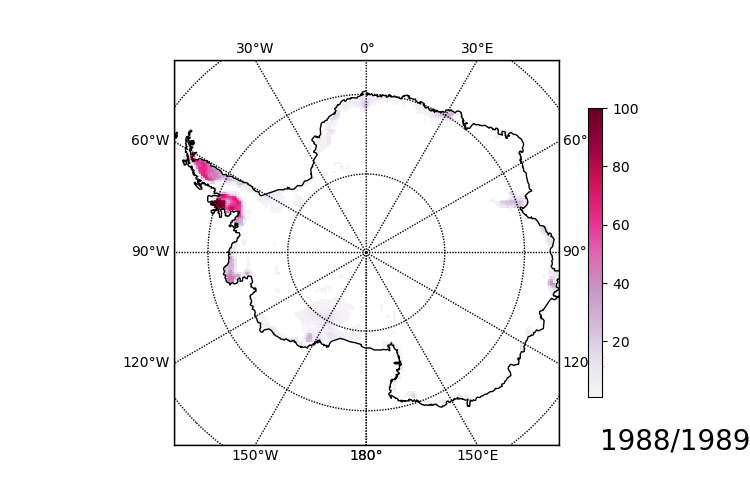
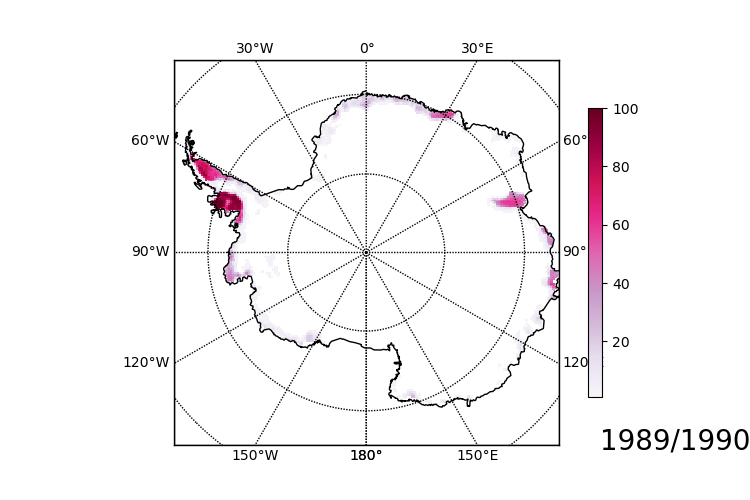
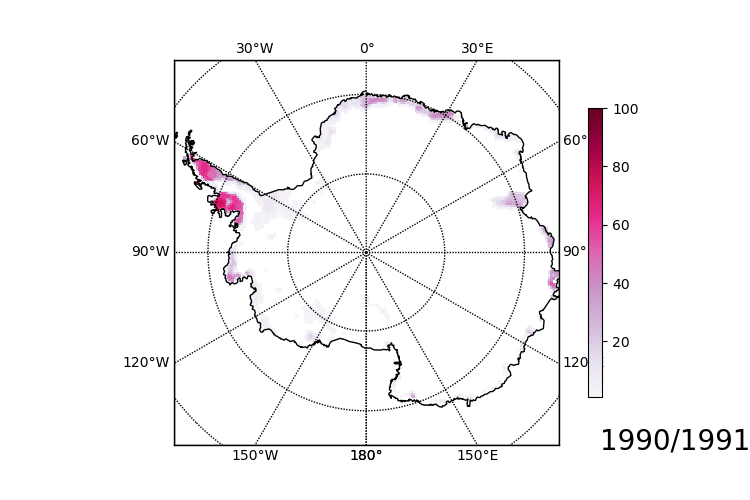
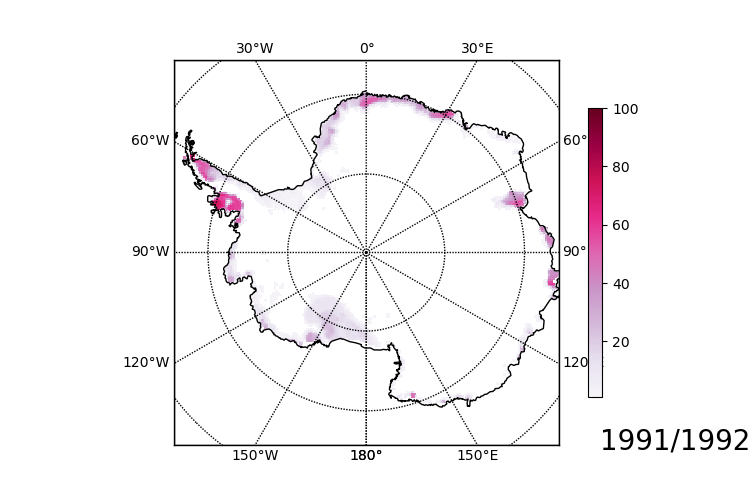
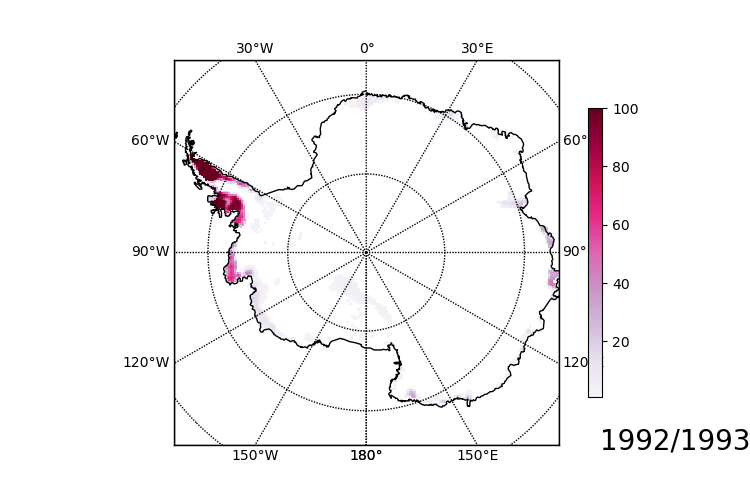
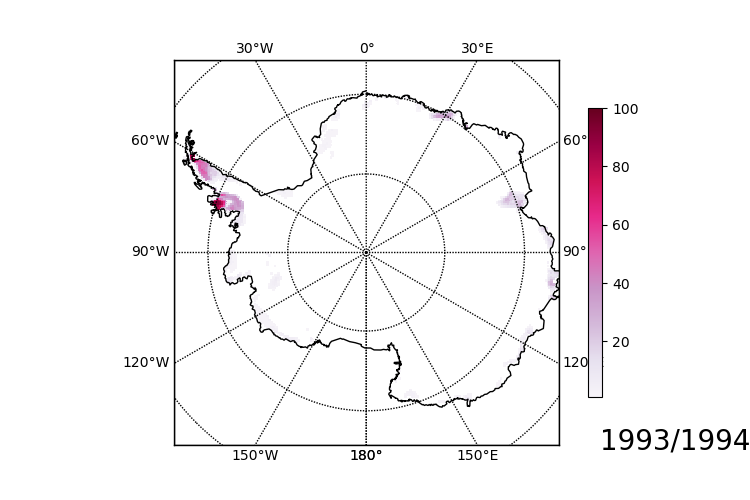
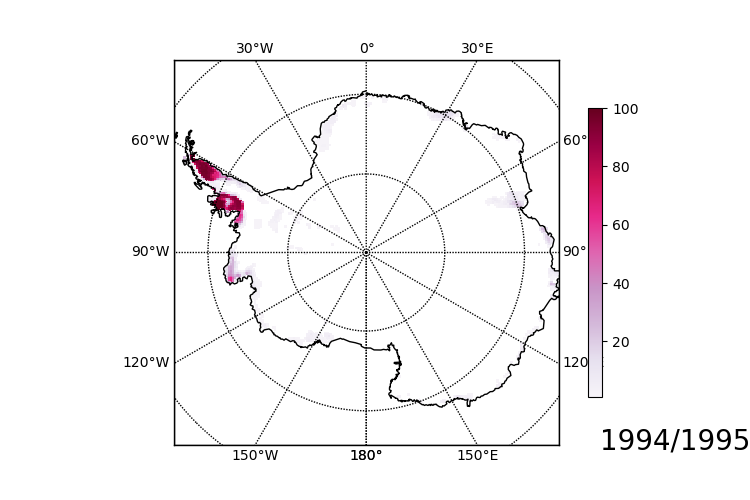
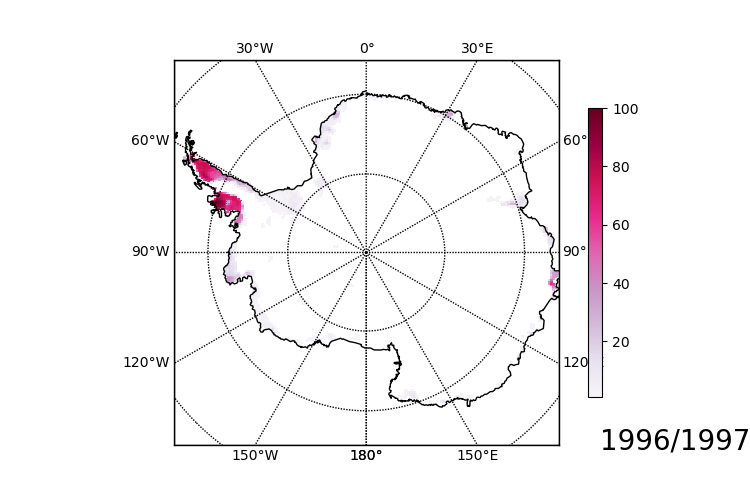
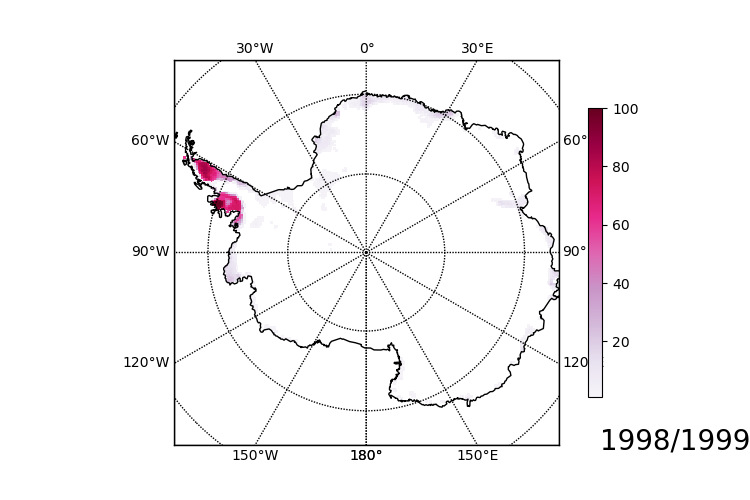
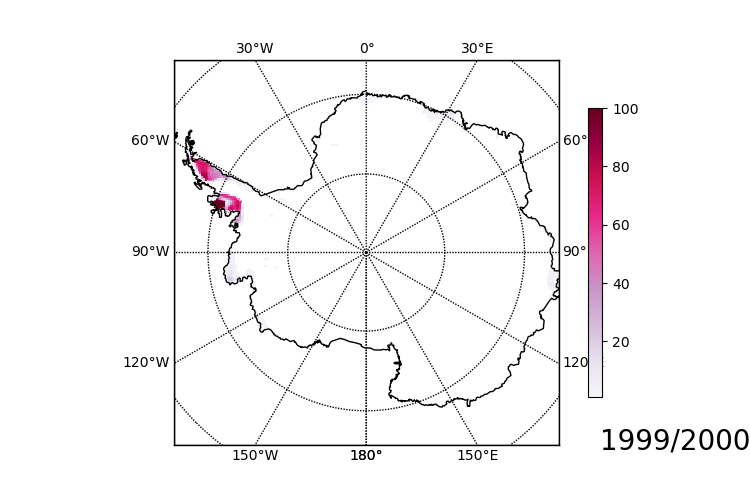
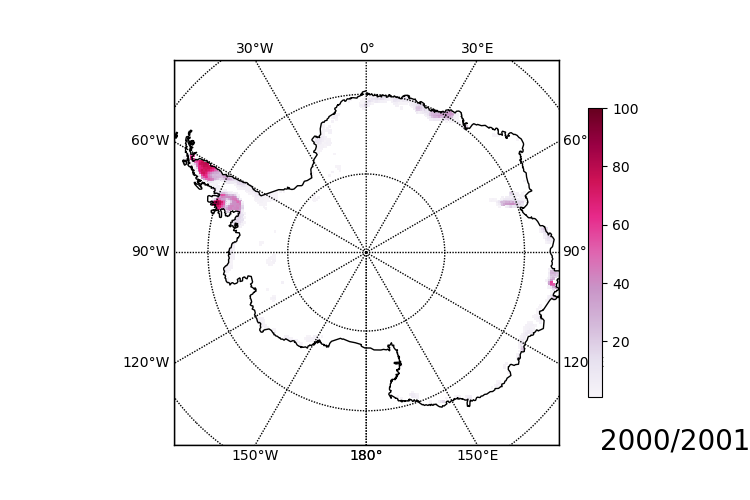
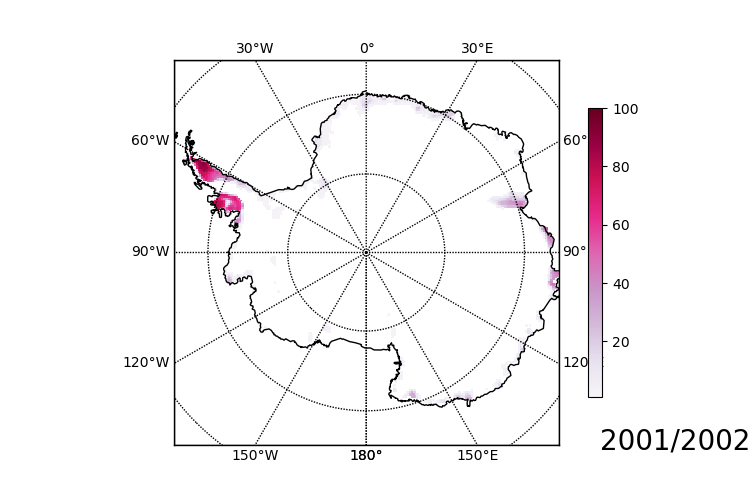
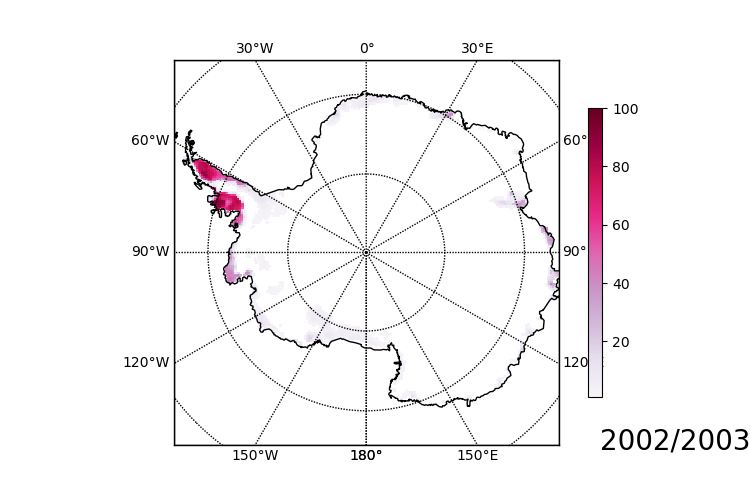
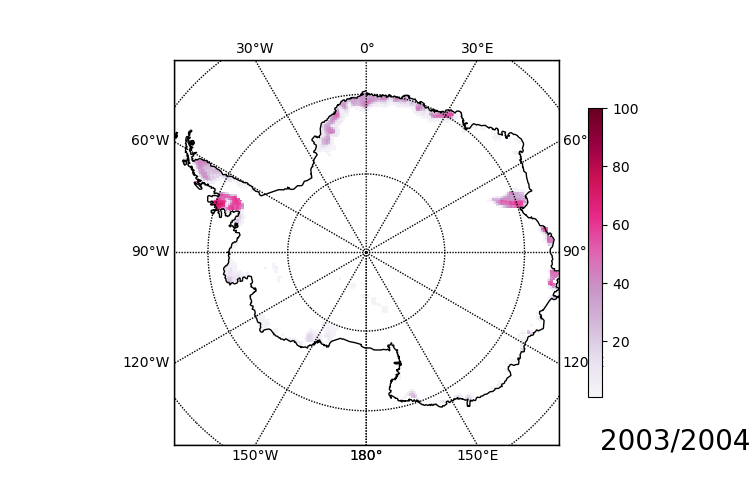
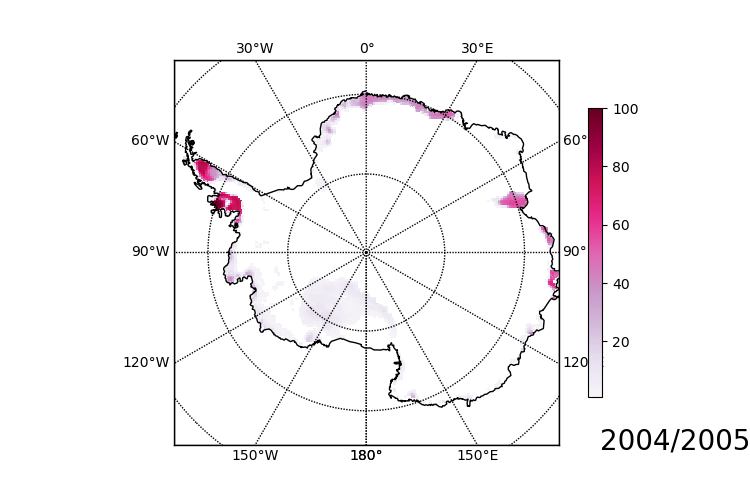
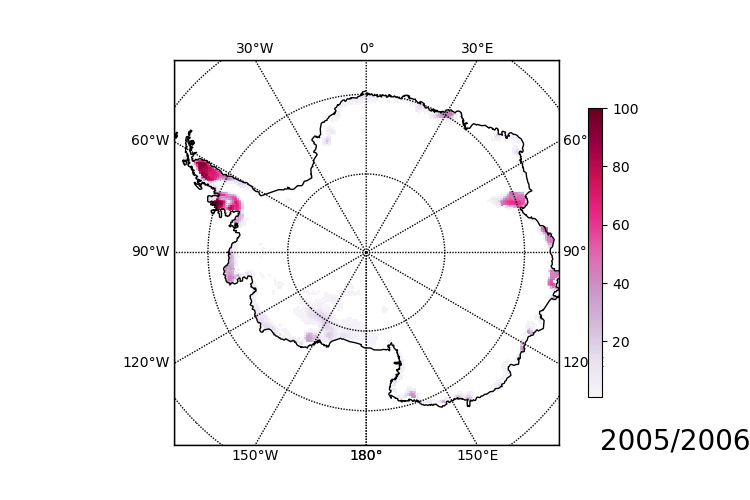
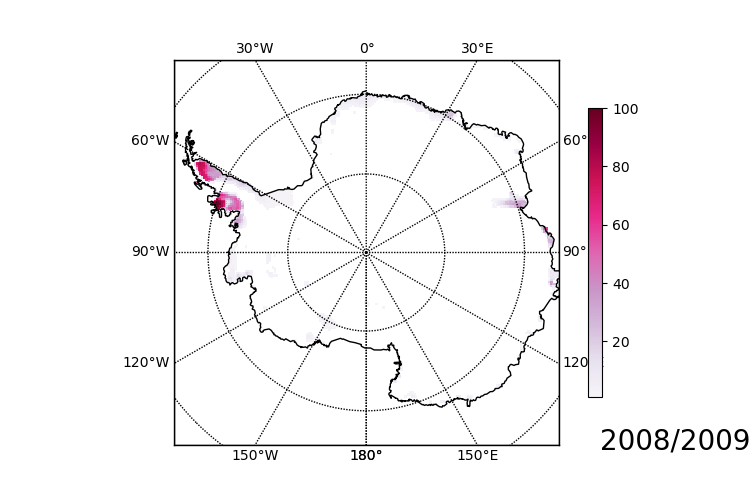
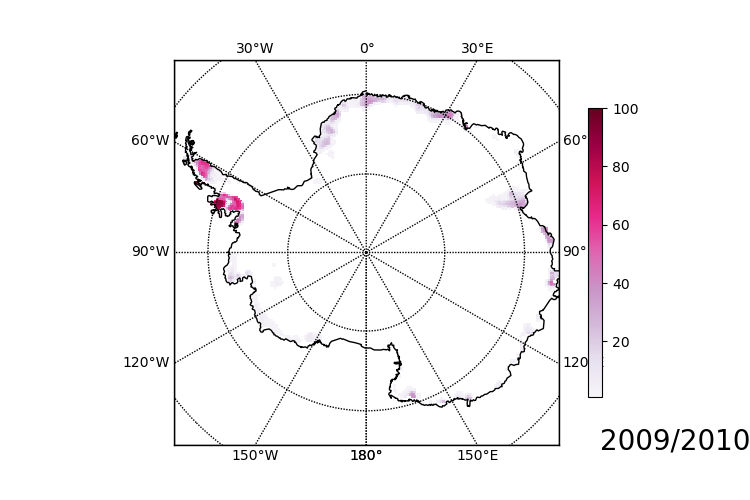
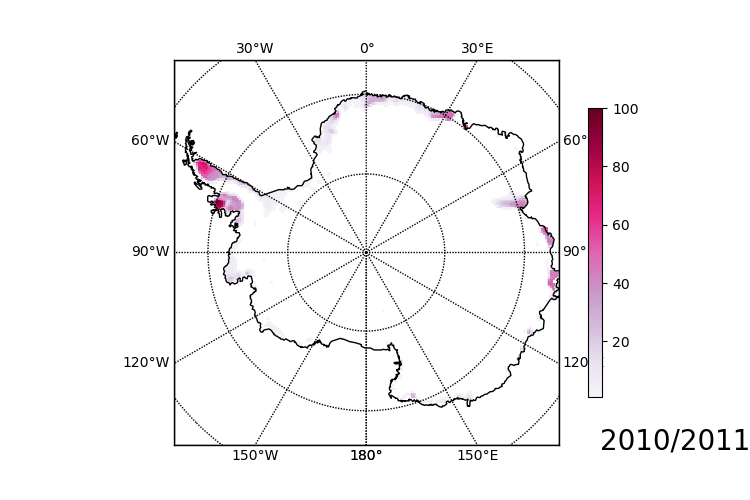
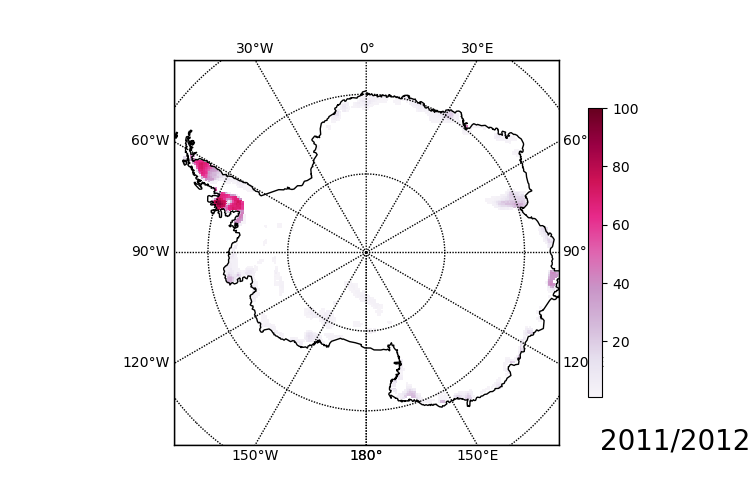
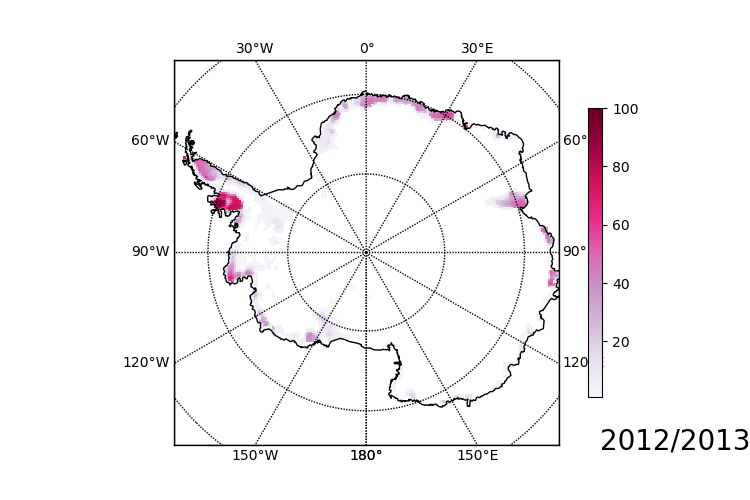
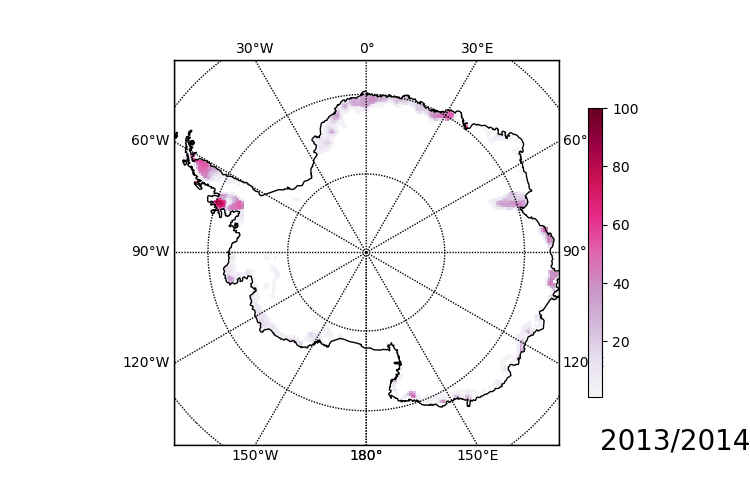
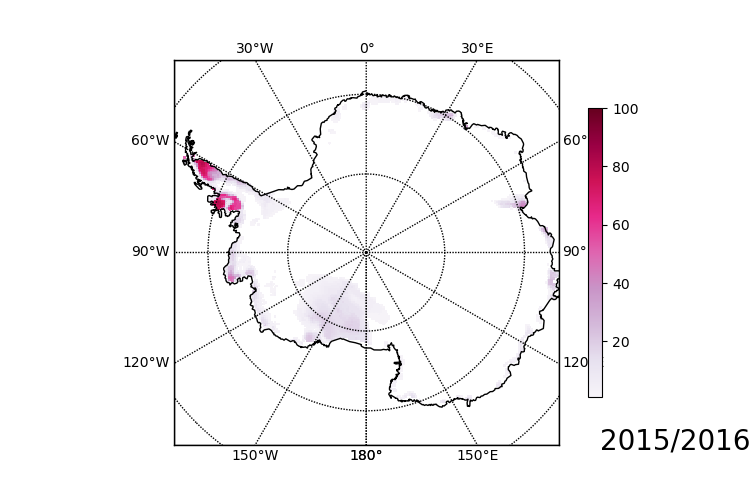
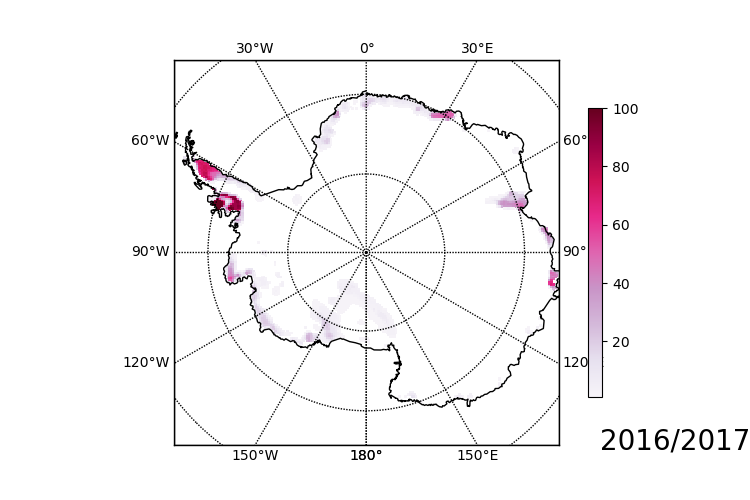
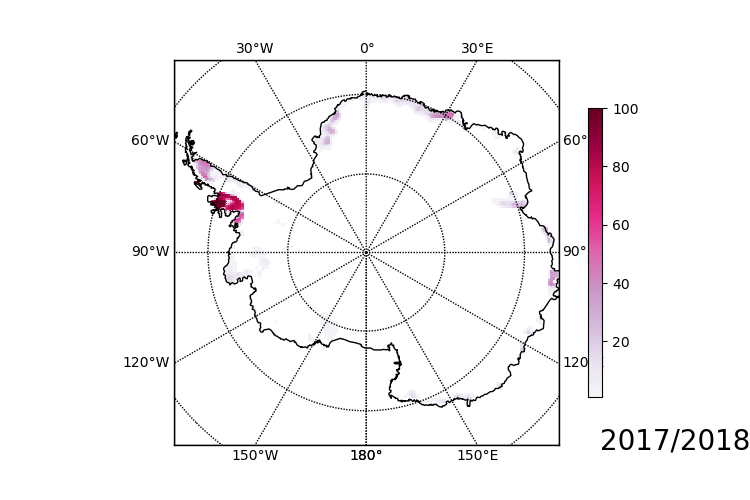
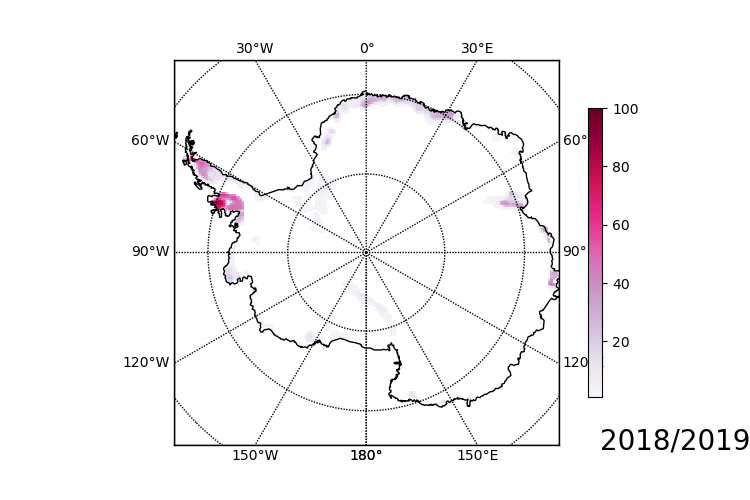
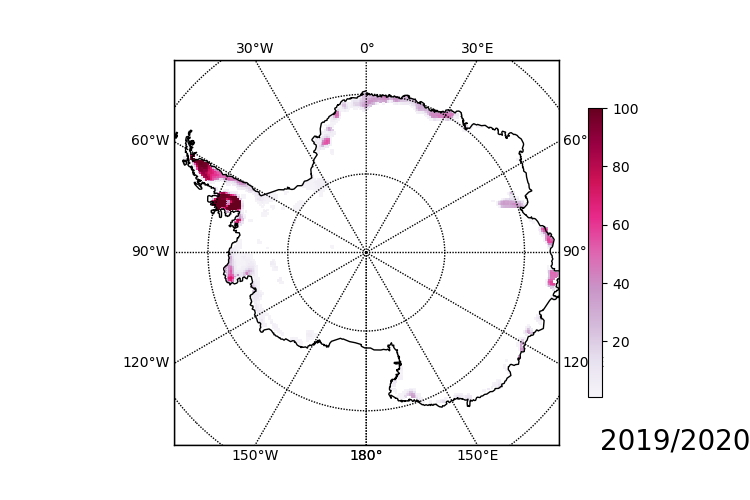
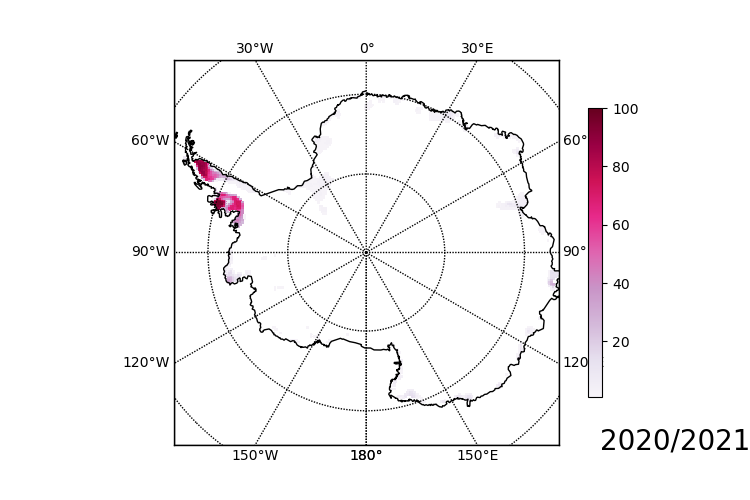
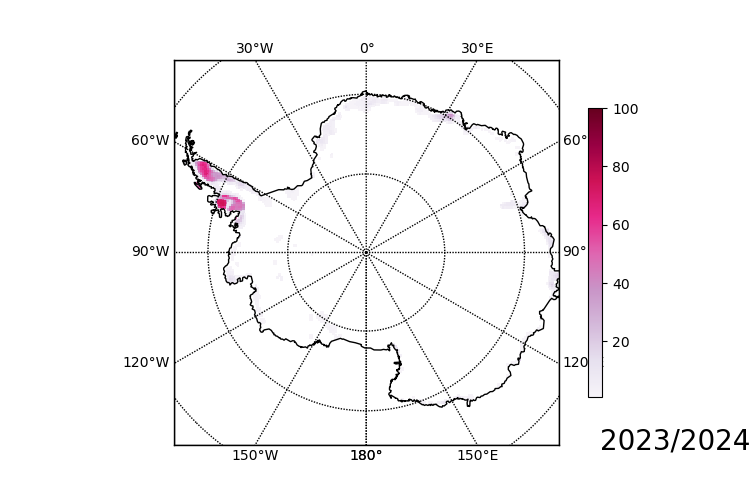
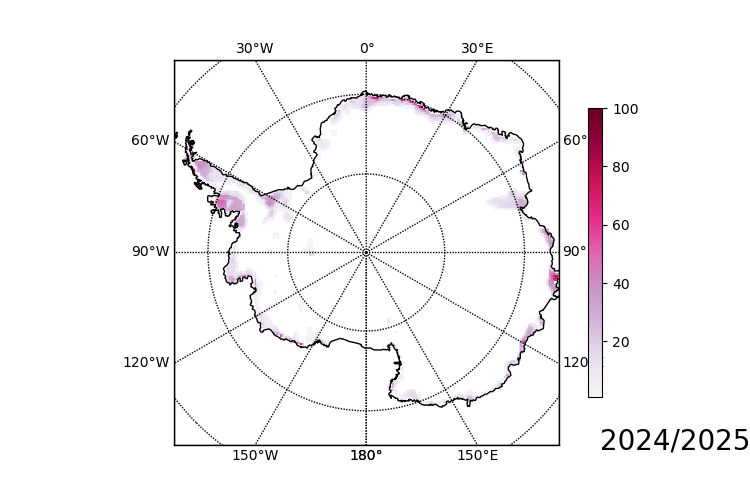
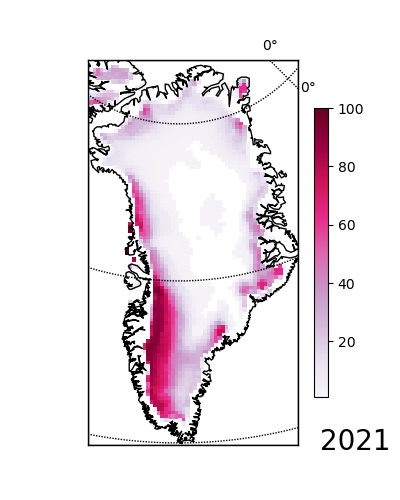
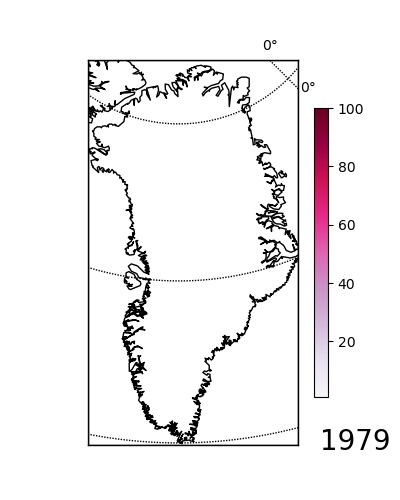
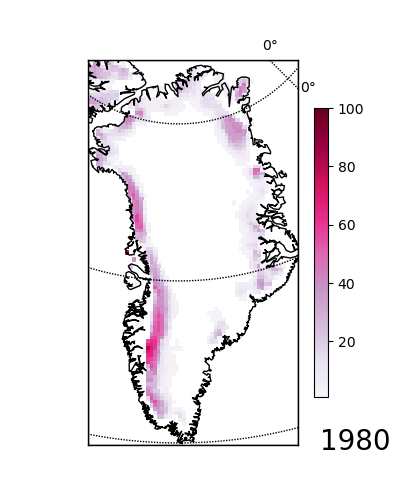
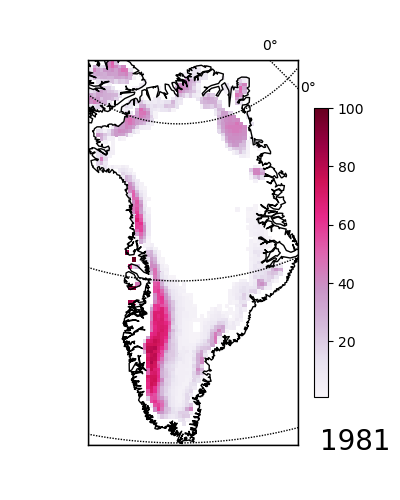
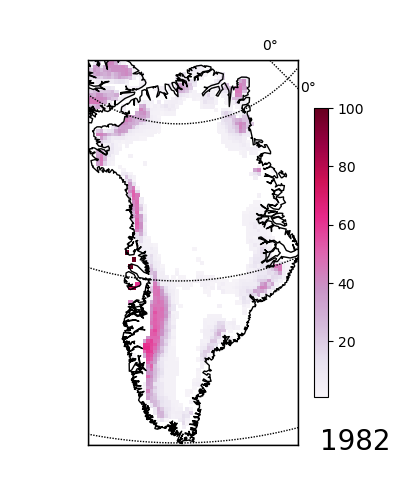
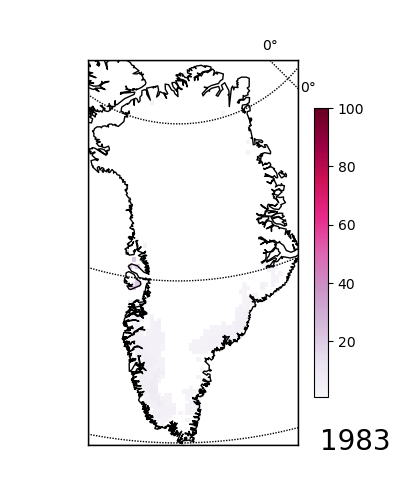
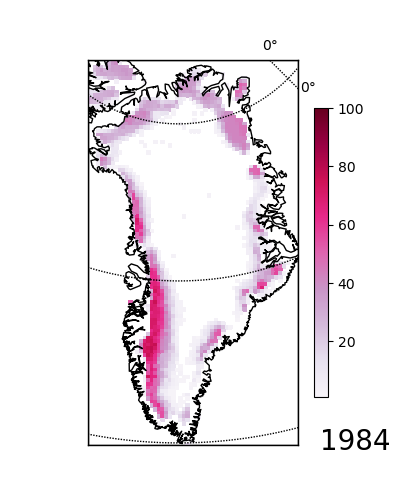
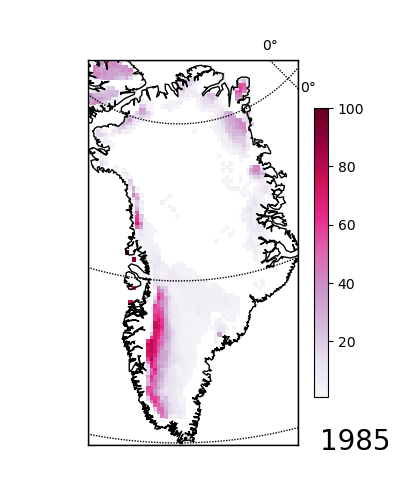
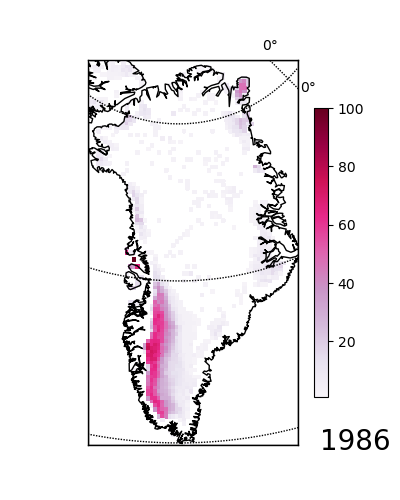
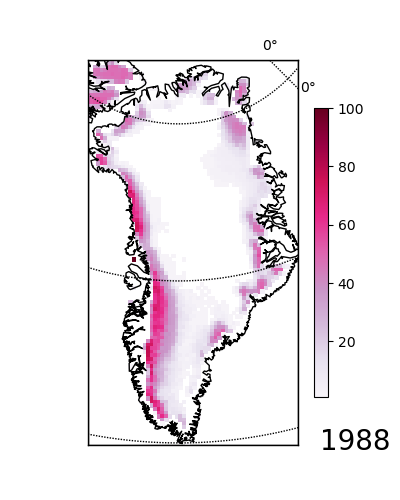
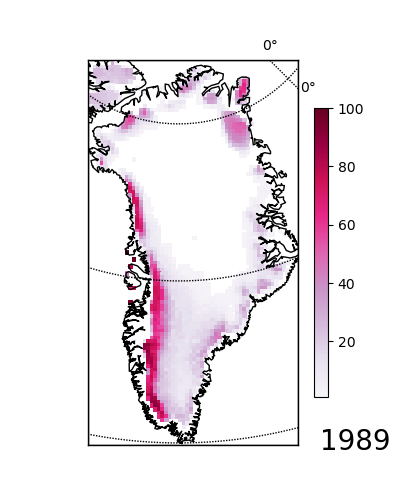
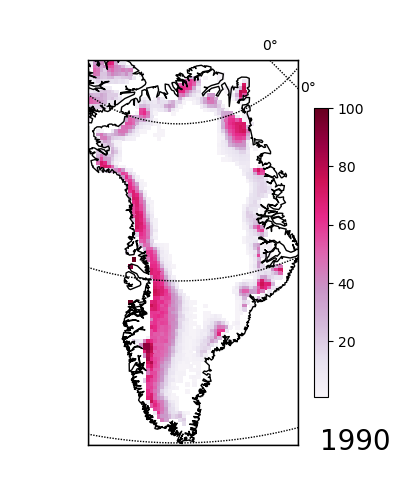
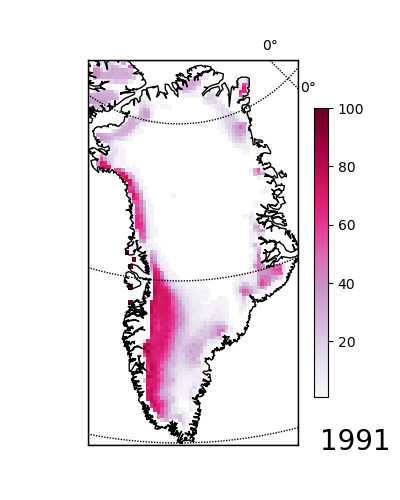
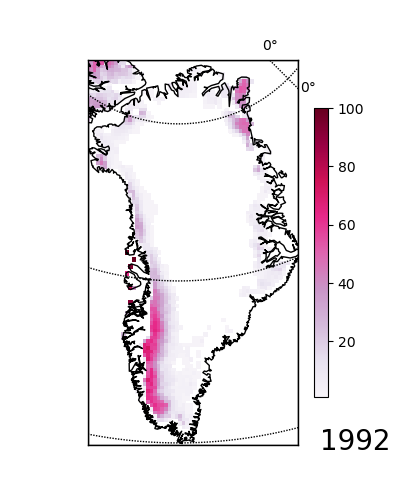
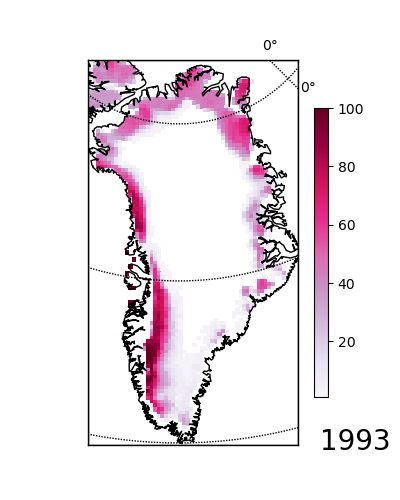
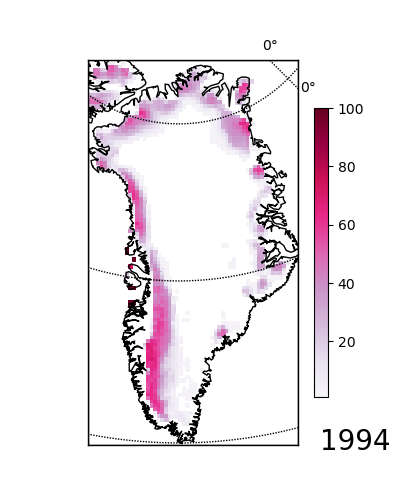
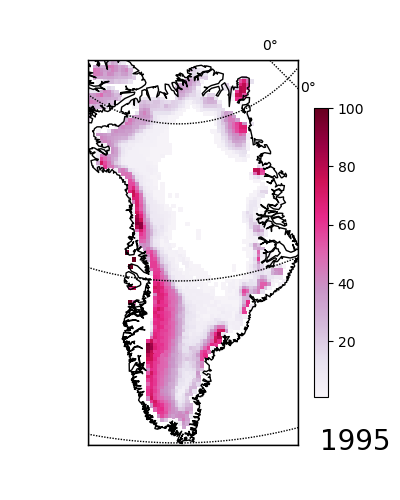
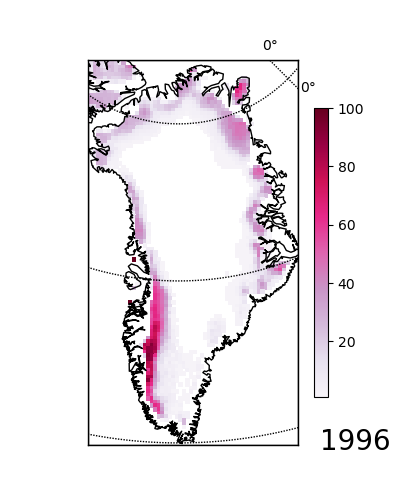
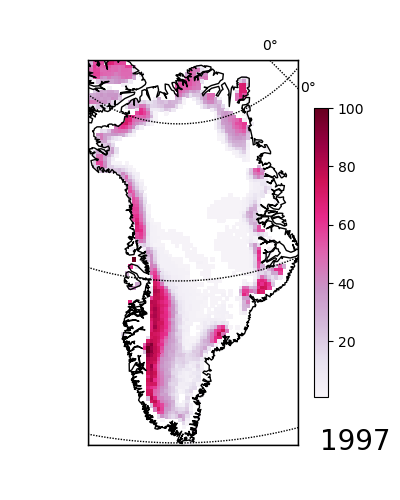
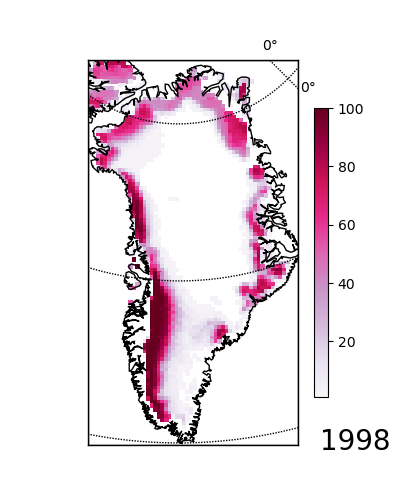
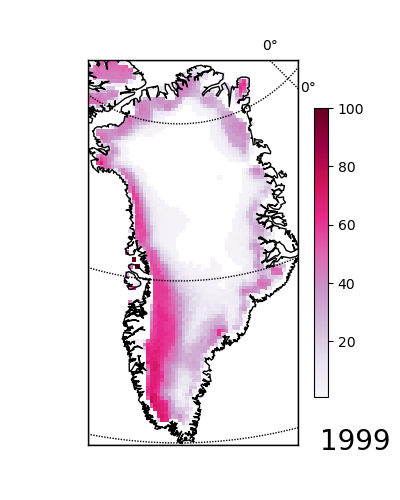
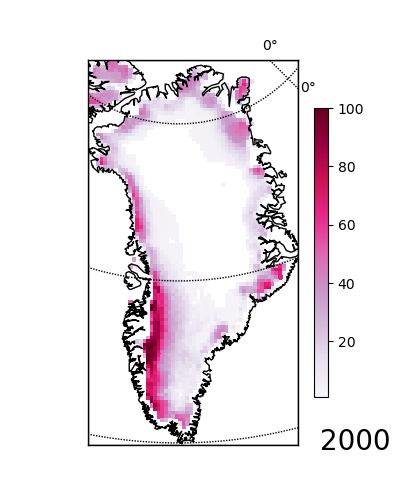
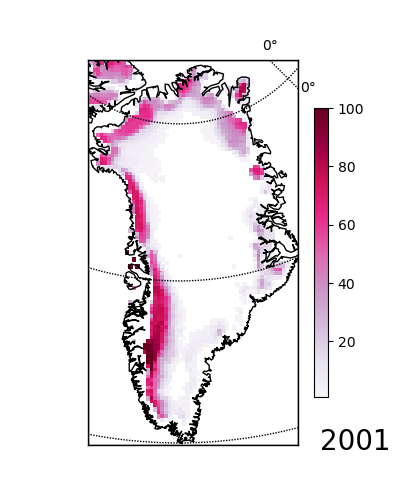
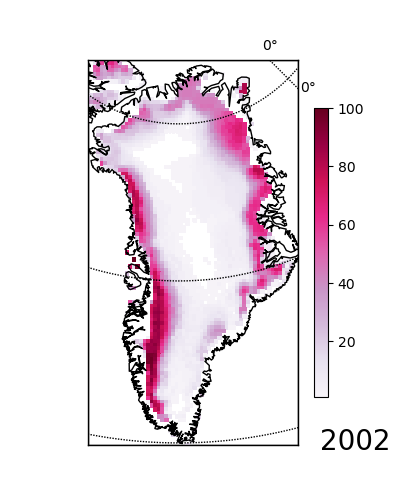
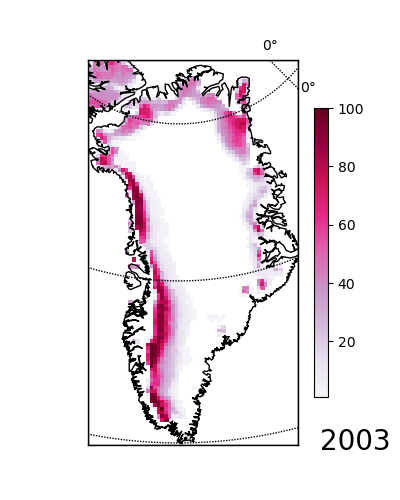
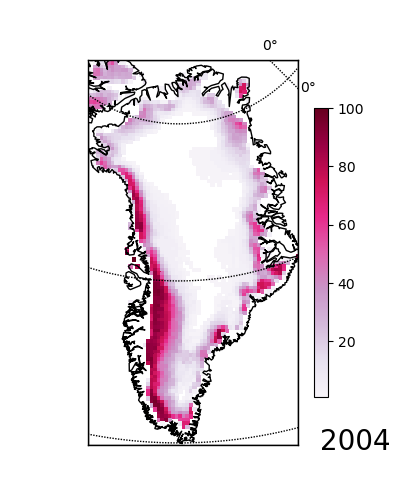
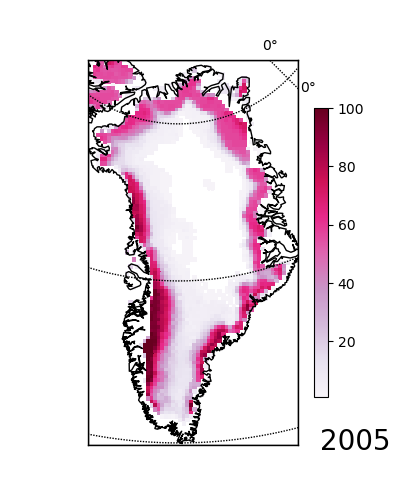
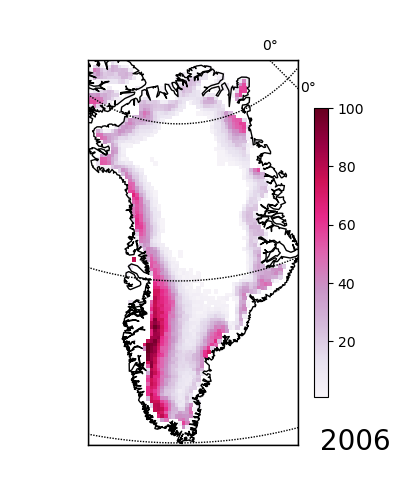
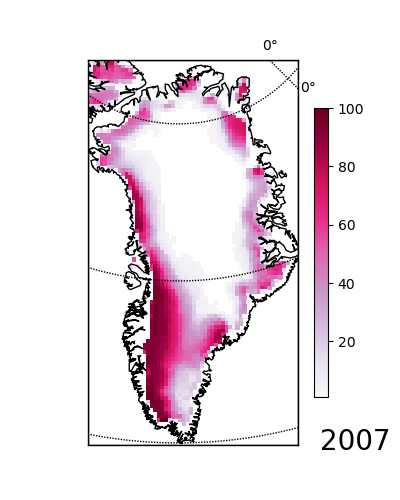
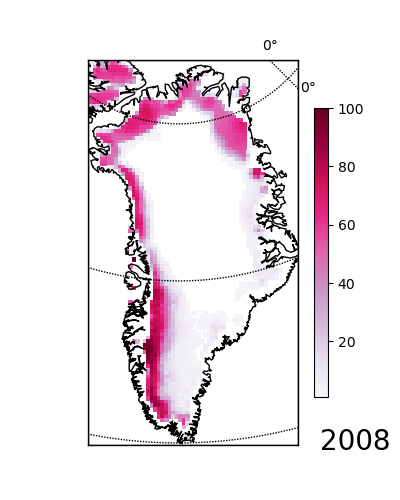
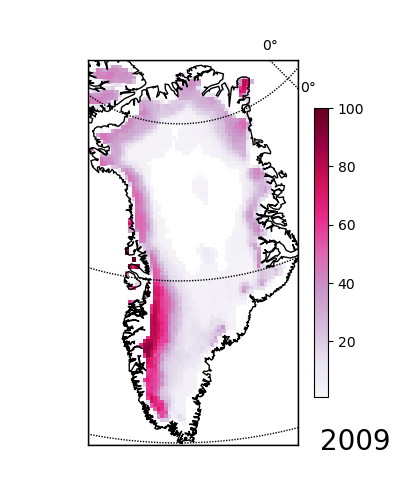
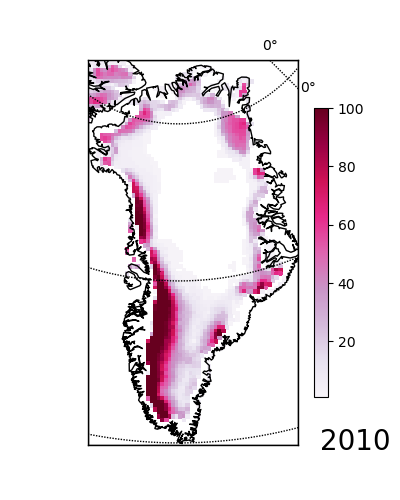
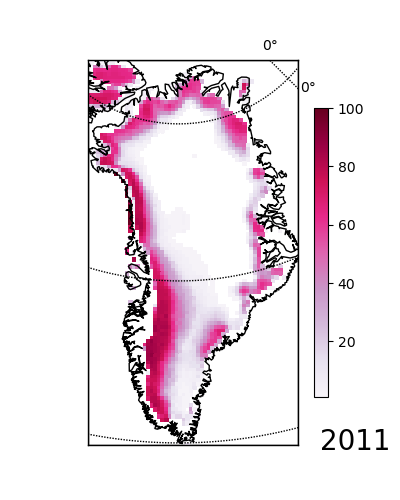
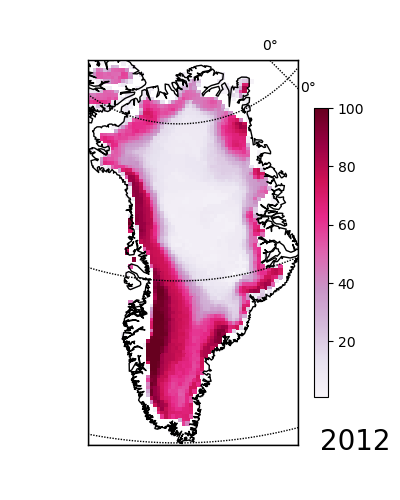
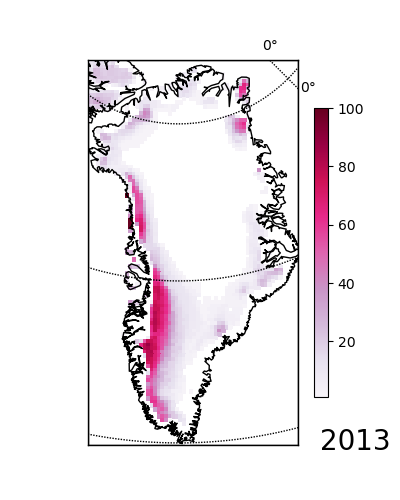
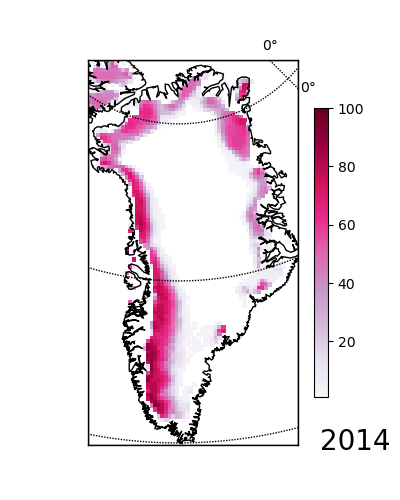
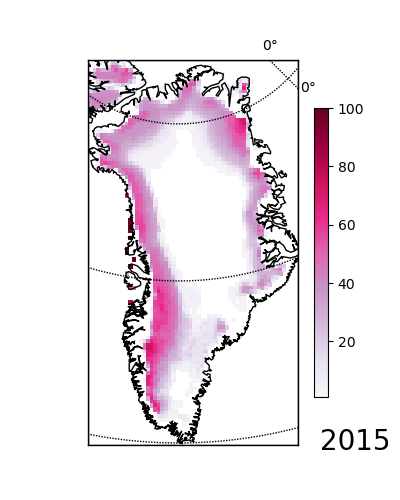
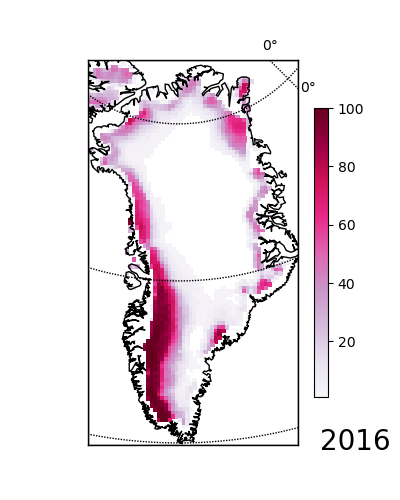
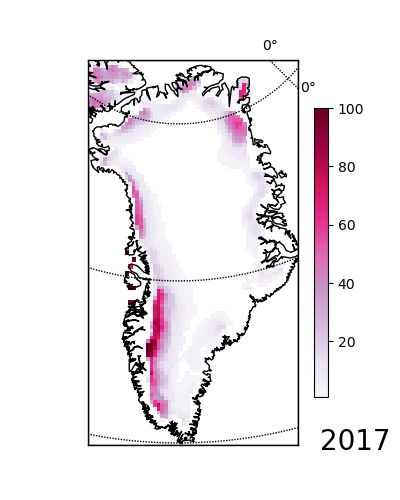
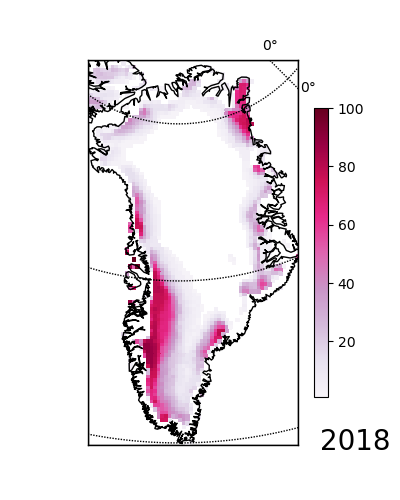
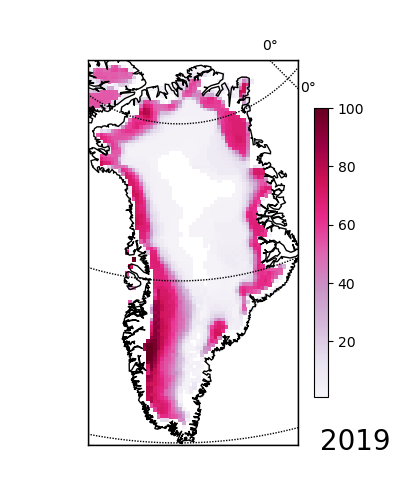
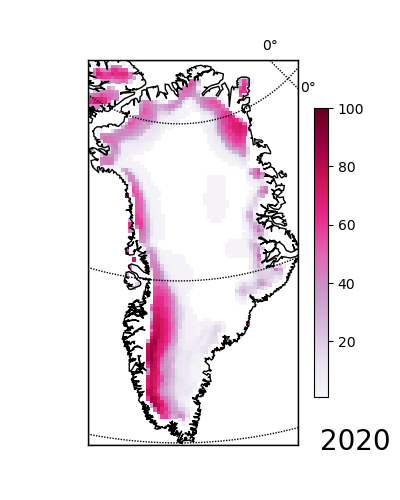
Surface melting maps.
The maps show the number of days with surface melt. During the SMMR period (1979-1987), the brightness temperature were linearly interpolated on every day before the application of the melt detection algorithm.n/a: 1987/1988 has a long summer gap


Bibliography.
-
G. Picard, M.Fily, 2006, Surface melting observations in Antarctica by microwave radiometers: correcting 26 year-long timeseries from changes in acquisition hours. Remote Sensing of Environment.
-
G. Picard, M. Fily, H. Gallee, 2007 Surface melting derived from microwave radiometers: a climatic indicator in Antarctica. Annals of Glaciology, vol 46, pp 29-34.
-
P. Kuipers Munneke, G. Picard, M. R. van den Broeke, J. T. M. Lenaerts, E. van Meijgaard, Insignificant change in Antarctic snowmelt volume since 1979, Geophysical Research Letter, vol. 39, L01501, 2012, doi:10.1029/2011GL050207
-
Torinesi O., M. Fily, and C. Genthon, 2003, Interannual variability and trend of the Antarctic summer melting period from 20 years of spaceborne microwave data, J. of Climate, 16(7), 1047-1060.
-
Zwally, H. J., Fiegles, S. (1994). Extent and duration of Antarctic surface 829
melting. Journal of Glaciology, 40(136), 463.
Last update: January 2024